
Trade Data Analytics System
A trade intelligence platform that turns import, export, services and remittance data into live dashboards and reports.
Project overview
TDAS gives decision makers a clear view of a country's trade: imports and exports, trade in services, remittances, transit trade and the balance of trade. The data comes from eight sources, including customs records, trade databases, economic indicators, ERP systems and ecommerce platforms.
It first launched in 2019. In 2025 it was extended with more data sources, better charts and deeper reporting, and it is still actively maintained.
Key results
Workflow
The platform runs on PHP with MongoDB, whose flexible schema copes with very different datasets and makes a new source quick to add. Highcharts draws the bar and line charts and the world maps.
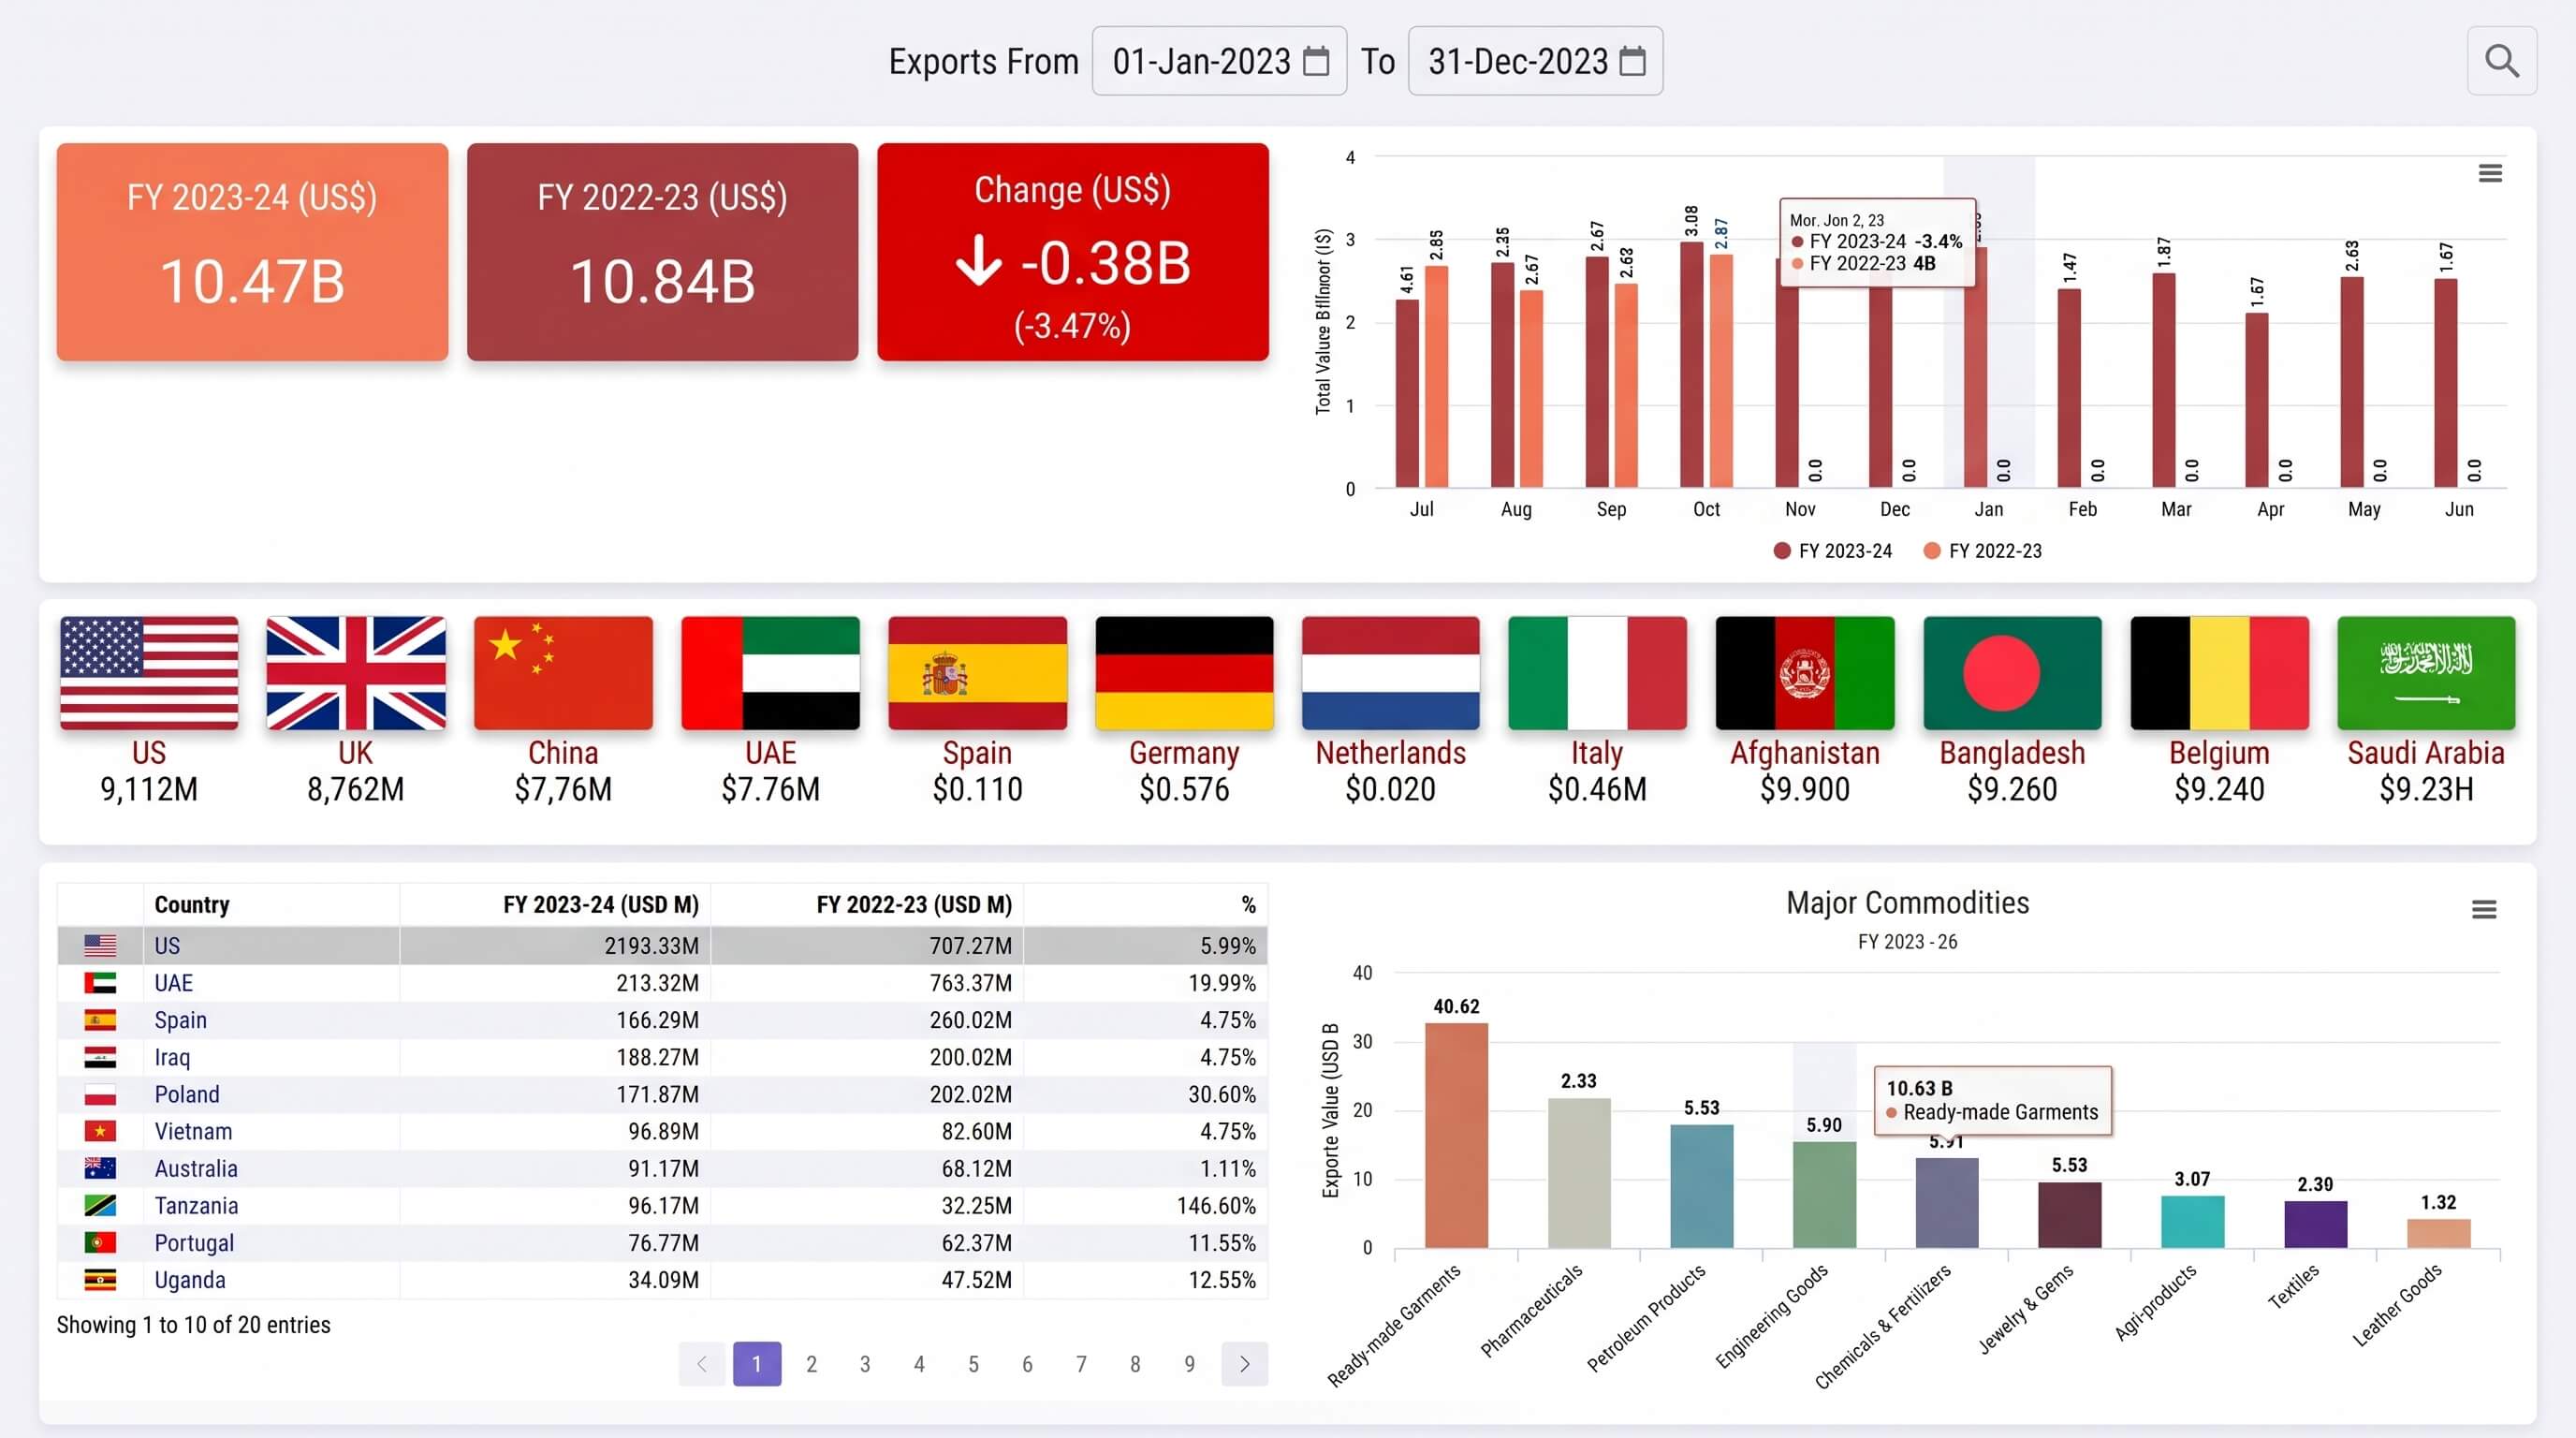
Dashboards cover exports and trade in services, with watchlists of growing commodities, seasonality by month and destination, and detailed reports by HS code and country that export to Excel and PDF. Admins set up data sources, queries, graphs, dashboards and reference data from one configuration menu, with role-based access throughout.
Got a build like this?
Book a free consultation and we’ll scope it against what we’ve already shipped.
Book a Consultation